Project: || Prior Study | Task 1 | Task 2 | Task 3 | Task 4 | Task 5 | Tasks 6-7 | Deliverables | Home
The Miasma Beach Transportation Model
Task 4. DEMAND FORECASTING: TRIP DISTRIBUTION
The last task involved the calibration of a set of trip generation models for the six internal zones. This next task applies a trip distribution model to obtain 2010 trip matrices for the three trip purposes of the generation models. Subsequent matrix adjustments include PA to OD conversion, factoring by time-of-day, and conversion of person to vehicle trips for trip assignment. Interactions with the external area are introduced in Task 5.
4.1 Base Trip Distribution Model Application
The output of the Task 3 Trip Generation procedure serves as one of two basic inputs to the Task 4 Trip Distribution procedure. The conventional Gravity Model distributes trips from production zones to attraction zones as a function of zonal productions and zonal attractions, both outputs of trip generation, and of some function of travel impedance. This measure of spatial separation is often taken as uncongested automobile network travel times, although most applications feed back congested travel times from trip assignment (often by weighted mode travel times). The gravity model can be singly-constrained (paired with attraction balancing), or doubly constrained, where all productions and attractions remain balanced in the estimated trip matrix. TransCAD can either calibrate a Gravity Model (i.e., estimate the function of travel impedance, or "friction factors"), or it can validate or forecast with an existing calibrated model.
2020 Model Analysis:
A set of friction factors estimated for the 2000 Miasma Beach model
will be used for the 2020 model application.
4.1.1 Open Input Data
To perform trip distribution analysis in TransCAD, the Travel Impedance Matrix
(skim trees) that was created in Task 2 is needed. Go to File / Open and
select the directory where the Task 2 results were saved. Select Matrix
as the file type; a list of matrix files created in Task 2 should appear. Select
skimtree.mtx and click OK. Open the TAZ dataview by first opening
the TAZ Geographic file and then clicking on the New Dataview button. This
table contains the production and attraction values that were estimated for each
TAZ in Task 3.
4.1.2 Appending Friction Factors
The trip distribution model requires not only production and attraction data,
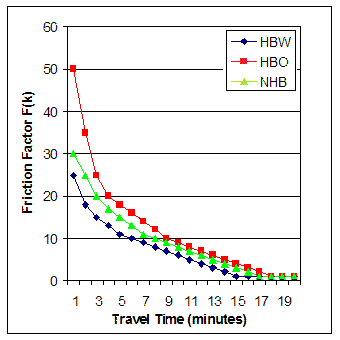
but also calibrated friction factors for the gravity model. Table 5 provides
friction factors by trip purpose that were calibrated in a prior Miasma Beach
modeling effort. Travel times which are greater than the table maximum utilize
the F-factor for the last category.
Check if there is a friction factor look up table (matching the values in Table 5) as part of the TransCAD dataset for Miasma Beach. If not, this file must be created. TransCAD uses the friction factor lookup table to generate friction factors for each zone pair.
|
HELP: Create Friction Factor Lookup Table Check if a friction factor look-up table file is included in the Miasma Beach data set; otherwise Click HERE for assistance. |
4.1.3 Utilizing K-Factors
The 2000 model calibration completed in 2000 did not utilize
"socio-economic adjustment" K-factors. State this explicitly in your report.
 Table 5. F-Factors (2000 and 2020)
 --------------------------------------
    Time        Friction Factor (Fij)
  (minutes)     HBW      HBO      NHB
 --------------------------------------
      1          25       50       30
      2          18       35       25
      3          15       25       20
      4          13       20       17
      5          11       18       15
      6          10       16       13
      7           9       14       11
      8           8       12       10
      9           7       10        9
     10           6        9        8
     11           5        8        7
     12           4        7        6
     13           3        6        5
     14           2        5        4
     15           1        4        3
     16           1        3        2
     17           1        2        1
     18           1        1        1
     19           1        1        1
     20 +         1        1        1
 --------------------------------------
|
|
4.2 Applying A Gravity Model
This task utilizes the Task 4 Trip Generation results with the Task 4.1 Friction Factor Analysis to apply a Doubly-constrained Gravity Model and produce a trip table for each defined trip purpose.
|
HELP: Applying a Gravity Model To specify the input data and parameters for a gravity model application, click HERE for assistance. |
TransCAD generates P-A flow matrices that match the productions and/or attraction vectors based on the structure of the friction factor matrix. TransCAD evaluates the 3 models, displays a Summary dialog box (with access to a Notepad file), indicates whether the three models converged, and also displays a matrix view (P-A) containing the results.
4.3 Model Output Adjustments
The trip table produced in Task 4.2 contains Production-Attraction distribution matrices for three trip purposes (see p-a.mtx file). These matrices represent total 24-hour person trips and must be converted to Origin-Destination vehicle trips for a defined analysis period (such as the AM-peak hour for Miasma Beach) prior to trip assignment.
4.3.1 Conversion from P/A Format to O/D Format
All demand analysis has thus far been expressed in terms of productions and
attractions. Prior to route assignment, the trip matrices must be converted to
origin-destination format. A simple process for doing so averages the original
and transposed trip matrices, an approach which is valid for 24-hour matrices
where most trips are paired with an equivalent trip in the reverse direction.
An appropriate time-specific trip table must be extracted for formal assignment
since network capacities (as with volumes) are temporal measures. Conversion of
the P/A matrices to O/D format must reflect observed time-of-day patterns. For
example, the majority of HBW trips have an origin at the production (residential)
end and a destination at the attraction (employment) end in the PM-peak.
Using the base year Miasma Beach Origin-Destination Survey, the percentages of trips by time-of-day were computed and are displayed in Table 6a. An hourly breakdown of trip percentages by time-of-day is provided in Table 6b. Tables 6a is (and 6b can be) used by TransCAD to extract appropriate O/D matrices from the 24-hour trip matrices and simultaneously convert person-trips to vehicle-trips.
2021 Model Analysis:
Miasma Beach is concerned with only the PM-peak period (defined as 5 to 6 PM).
Create or modify the Hourly Look-up Table to reflect the appropriate factors
in Table 6A for the analysis period in question, adjusting other hourly factors
appropriately.
      Table 6a. Temporal Distribution of Trips by Purpose
------------------------------------------------------------------
                         -- HBW --      -- HBO --      -- NHB --
     Analysis Period     PA     AP      PA     AP      PA     AP
------------------------------------------------------------------
1-hr AM-peak (7-8 am)   0.15   0.00    0.04   0.01    0.03   0.03
1-hr PM-peak (5-6 pm)   0.03   0.10    0.03   0.05    0.04   0.04

Full AM-peak (7-9 am)   0.28   0.00    0.08   0.02    0.04   0.04
Full PM-peak (4-7 pm)   0.05   0.30    0.09   0.15    0.12   0.12
Off-peak (other)        0.17   0.20    0.33   0.33    0.34   0.34
------------------------------------------------------------------
|
HELP: Create Hourly Lookup Table Check if an hourly look-up table file included in the base Miasma Beach data set; otherwise Click HERE for assistance. |
4.3.2 Conversion from Person Trips to Vehicle Trips
An analysis of the household interview survey conducted previously in this
study has produced estimates of vehicle occupancy by trip purpose.
   Table 7. Base Year Vehicle Occupancy by Trip Purpose [S'21]
-----------------------------------------------------------------
     Type      Trip purpose           Average Vehicle Occupancy
-----------------------------------------------------------------
  1. HBW       Home-based Work          1.10 persons/vehicle
  2. HBO       Home-based Other         1.40 persons/vehicle
  3. NHB       Non-home-based           1.20 persons/vehicle
-----------------------------------------------------------------
Model Adjustments:
Adjust the estimated trip matrices to reflect a PA to OD format conversion,
the selected time-of-day period, and the adjustment for vehicle occupancy.
|
HELP: Model Adjustments To adjust trip tables for PA-OD conversion, time-of-day, and vehicle occupancy, click HERE for assistance. |
4.3.3 Creation of Total Purpose File
The last step in developing the base O/D table is the creation of a combined
trip purpose file (since all trip types load on the network at the same time).
This table is saved as a fourth table in the same TransCAD file.
|
HELP: Create Total Trip Purpose Table To combine individual trip tables for different trip purposes into a combined (or total) trip table file Click HERE for assistance. |
4.4 Interim Report
Prepare a Task 4 Interim Report documenting trip distribution model development. Append a project Glossary containing at least four key terms from the Task 4 analysis (extending the Glossary from Task 3). Include graphics and auxiliary material. Follow Report Style Guidelines in the preparation of this report. This report will be submitted as part of Interim Report 2 with the results of Tasks 3 and 5.