Homework #8 -- Trip Assignment [ Due: Friday, 5 June 2026 ]
Homeworks 6 and 7 utilized data pertaining to a hypothetical five zone region. The data set included surveyed production, attractions, and activity system variables for the base year (2020) as well as estimates of activity system variables for the future year (2030).
Table 1a. Travel Times ; HBW Ps & As ; Base and Future Demographics
----------------------------------------------------------------------
         -Base Travel Time-   -Base Trips-  -Base Demo-  -Future Demo-
 From\To  1   2   3   4   5   PROD   ATTR   WORK   EMPL   WORK   EMPL
----------------------------------------------------------------------
   1      1   3   3   6   3      0    450      0    220      0    216
   2      3   1   2   6   5      0    250      0    110      0    118
   3      3   2   1   5   6    300      0    140      0    250      0
   4      6   6   5   1   4      0    300      0    140      0    166
   5      3   5   6   4   1    700      0    360      0    472    166
----------------------------------------------------------------------
 Totals                       1000   1000    500    470    722    666
----------------------------------------------------------------------

                    Table 1b. Base HBW Trip Table
                    ------------------------------
                     FROM\TO    1    2    4  Prod
                    ------------------------------
                        3     125  125   50  300
                        5     325  125  250  700
                    ------------------------------
                      Attr    450  250  300 1000
                    ------------------------------
In Homework 6, a HBW trip gravity model was calibrated and forecasts completed for both generation and distribution (with specified network and activity changes). In Homework 7, trip table adjustments produced a peak period vehicle trip matrix in OD format for all purposes. The problems below continue this sequence.
Problem 8. Trip Assignment [20 points]
The study area network is shown below (Node 6 is an interchange, not a centroid).
Links are labeled with length in miles. For the AM-peak period, assume average auto
speeds of 30 mph. Assign total AM-peak vehicle demand. Use the estimated
AM-peak Period HBW O-D vehicle trip matrix from Problem 7 and the HBO and NHB matrices
in Table 8. Use All-or-Nothing Assignment based on shortest time paths (verify
path results with skims provided in Table 1a). Show all work, and include a network
map depicting link volumes.
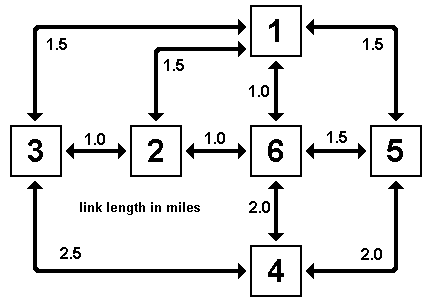
Table 8. AM-peak Period HBO and NHB Vehicle-trip O-D Matrices
------------------------------------------------------------------
      -- HBO Vehicle-trips -         -- NHB Vehicle-trips --
Fr\To   1   2   3   4   5  Tot    Fr\To   1   2   3   4   5   Tot
------------------------------------------------------------------
  1     0   0   2   0   3    5      1     5   2   1   0   1     9
  2     0   0   4   0   4    8      2     2   3   1   3   1    10
  3     5  11   3   2  12   33      3     1   1   1   1   1     5
  4     0   0   1   0   2    3      4     0   3   1   3   1     8
  5     9  11  18   7  27   72      5     1   1   1   1   1     5
------------------------------------------------------------------
 Tot   14  22  28   9  48  121     Tot    9  10   5   8   5    37
------------------------------------------------------------------
Problem 9. Trip Assignment: Updating [10 points]
After network assignment, re-compute link travel times using the FHWA/BPR
Link Performance Function. Summarize in tabular format. Assume the default
values of alpha (0.15) and beta (4.0) and link capacities of 25 vehicles per hour
(or 50 vph for the 2-hour AM-peak period). The FHWA LPF is:
ta = ta0 [1 + α(xa/ca)β]
where: ta = link travel time ;
ta0 = free flow link travel time ;
xa = link volume ;
ca = link capacity
- Explain how these adjusted link travel times would be used to find the UE solution.
- Compute at least one system-level performance measure (mean speed, VMT, etc.)
Problem 10. Trip Assignment: Screen Line Performance [10 points]
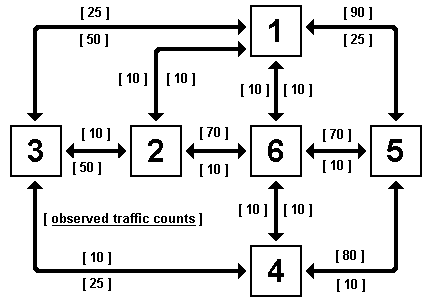
Observed traffic counts for the AM-peak period are provided below. Using observed and estimated
volumes, compute the volumes associated with screen lines drawn to isolate residential
(HB production) zones from employment (HB attraction) zones.
The first screen line (A) will cut links (3,1), (3,2), and (3,4);
the second screen line (B) will cut links (1,5), (6,5), and (4,5).
- Show your screen line results graphically and tabulate the difference between observed and estimated directional volumes across the screen lines.
- Select a third screenline and repeat the analysis. Describe what types of flow are being measured.
- Compute the directional GEH statistics for each screen line (convert to 1-hour flows).
Problem 11. Trip Assignment: Network Performance [10 points]
Summary statistics help describe the overall flow pattern at the end of the full modeling process.
- Using estimated link volumes and updated travel times for the base network, compute VHT, VMT, and the average travel speeds for the 2020 base year. Hint: Use a spreadsheet!
- Compare these results with the Trip Distribution results in HW 6 Problem 3.
- Compute the GEH statistic for each link (convert to 1-hour flows). Evaluate based on the GEH standard.
Problem 12. Developing Alternatives [5 points]
Given observed 2020 loads on the base network, propose and justify three
alternate transportation system designs for 2030:
- one that addresses infrastructure enhancements (e.g., new links)
- one that addresses operational improvements (new link characteristics), and
- one that addresses demand
NOTE: HW 6 through 8 provide an extremely useful exercise which illustrates the sequential application of the four step model and, thus, serves as excellent preparation for the final exam.
Last Updated: 27 May 2026