Spring 2021: Michael G. Mc Nally (mmcnally-at-uci-dot-edu) [15460]
Homework 8. Trip Assignment Modeling [Due: Wednesday 2 June 2021]
The following problems deal with a hypothetical, 4-zone region (this data was used in prior homework assignments). Table 1 summarizes activity system and HBW trip generation data (Ps and As) for 2020, and estimates of activity system variables for 2030. Use the Table 2 base Trip Distribution in all problems.
 Table 1. Base and Future HBW Trips and Demographic Data Summary
-----------------------------------------------------------------
        HBW        HH(i)      C(i)       W(i)       E(j)    I(i)
     P(i) A(j)  Households    Cars      Workers     Empl.   Inc.
Zone  '20  '20  ---------- ---------- ---------- ---------- -----
                 '20  '30   '20  '30   '20  '30   '20  '30  both
-----------------------------------------------------------------
  1   825  710   321  330   447  460   390  395   300  300   Low
  2   775  800   402  470   360  420   345  480   360  450   Med
  3   910  970   330  300   396  375   582  570   600  690  High
  4   865  895   375  420   450  465   399  450   456  455   Med
-----------------------------------------------------------------
 Tot 3375 3375  1428 1520  1653 1720  1716 1895  1716 1895   N/A
-----------------------------------------------------------------

Table 2. Base Travel Time and Trip Distribution Tables
-----------------------------------------------------------------
 From\To   1   2   3   4      From\To    1    2    3    4   P(i)
-----------------------------------------------------------------
     1     5  16  13  18          1    250  125  375   75    825
     2    16   7  20  12          2    100  400   50  225    775
     3    13  20   2   9          3    205   60  225  420    910
     4    18  12   9   3          4    155  215  320  175    865
-----------------------------------------------------------------
                                A(j)   710  800  970  895   3375
-----------------------------------------------------------------
Problem 8. Trip Assignment (20 points)
Assign total AM-peak vehicle demand to the network based on minimum time paths and All-or-Nothing (AON) Assignment. Use the estimated HBW O-D vehicle trip table from Problem 6 and the HBO and NHB tables provided in Table 8. Show all work, including an assignment table and a network map of assigned link volumes (use desire lines and/or annotated links).
Table 8. HBO and NHB AM-peak Vehicle-trip OD Tables
--------------------------------------------------------
        -------- HBO --------     -------- NHB --------
Fr\To     1   2   3   4  O(i)      1   2   3   4  O(i)
--------------------------------------------------------
  1      30  18  53   9  110       5   5  18   2   30
  2      12  54   7  27  100       6  50   8   6   70
  3      44  15  56  95  210      16   9  42  13   80
  4      29  48  69  34  180       2   6  11   1   20
--------------------------------------------------------
 Tot    115 135 185 165  600      29  70  79  22  200
-------------------------------------------------------
Problem 9. Trip Assignment: Updating (10 points)
After trip assignment, re-compute link travel times using the BPR
Link Performance Function. Assume the default values of alpha (0.15) and
beta (4.0) and link capacities of 100 vehicles for the combined 2-hour
AM-peak period. Tabulate these results (you may append to the
table produced for Problem 8). Explain how these adjusted link travel
times would be used to find the UE solution. The FHWA LPF is:
ta = ta0
[1 + alpha(xa/ca)beta]
where:
ta = travel time on link a (minutes)
ta0 = free flow travel time on link a (minutes)
xa = volume of link a (vph)
ca = capacity of link a (100 vehicles per 2-hour peak period)
Problem 10. Trip Assignment: Performance (10 points)
Compare estimated link volumes to observed counts in Figure 10 using a screen line drawn from the upper left to the lower right of the network, crossing links (2-5), (2-6), (4-6), and (4-3). Tabulate the volumes by direction crossing the screenline, compute percent deviations, and depict the results graphically.
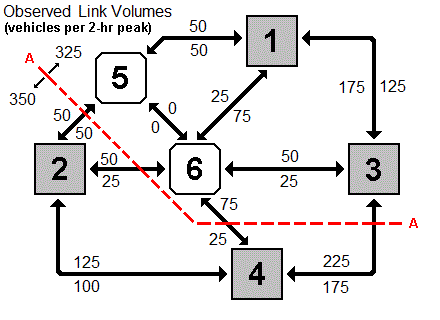
Problem 11. Trip Assignment: Performance (10 points)
Summary statistics help describe the overall flow pattern at the end of the full modeling process. Using final link volumes and re-computed travel times for the base network, compute the average travel speeds for the 2020 base year. Link results will allow you to compute total vehicle-hours traveled (VHT) and total vehicle-miles traveled (VMT) for total travel in the AM-peak period. Be sure to estimate VHT and VMT for (unassigned) intrazonal trips. Compare these results with Problem 4 (in HW 6).
Problem 12. Develop a Network Alternative (5 points)
Given observed 2020 loads on the base network, propose and define an alternative transport system design.Last Updated: 24 May 2021