Homework #3 -- Shortest Path Algorithms / Skim Trees [Due: Friday, 15 April 2022]
Problem 1. Network Characteristics [10 points]
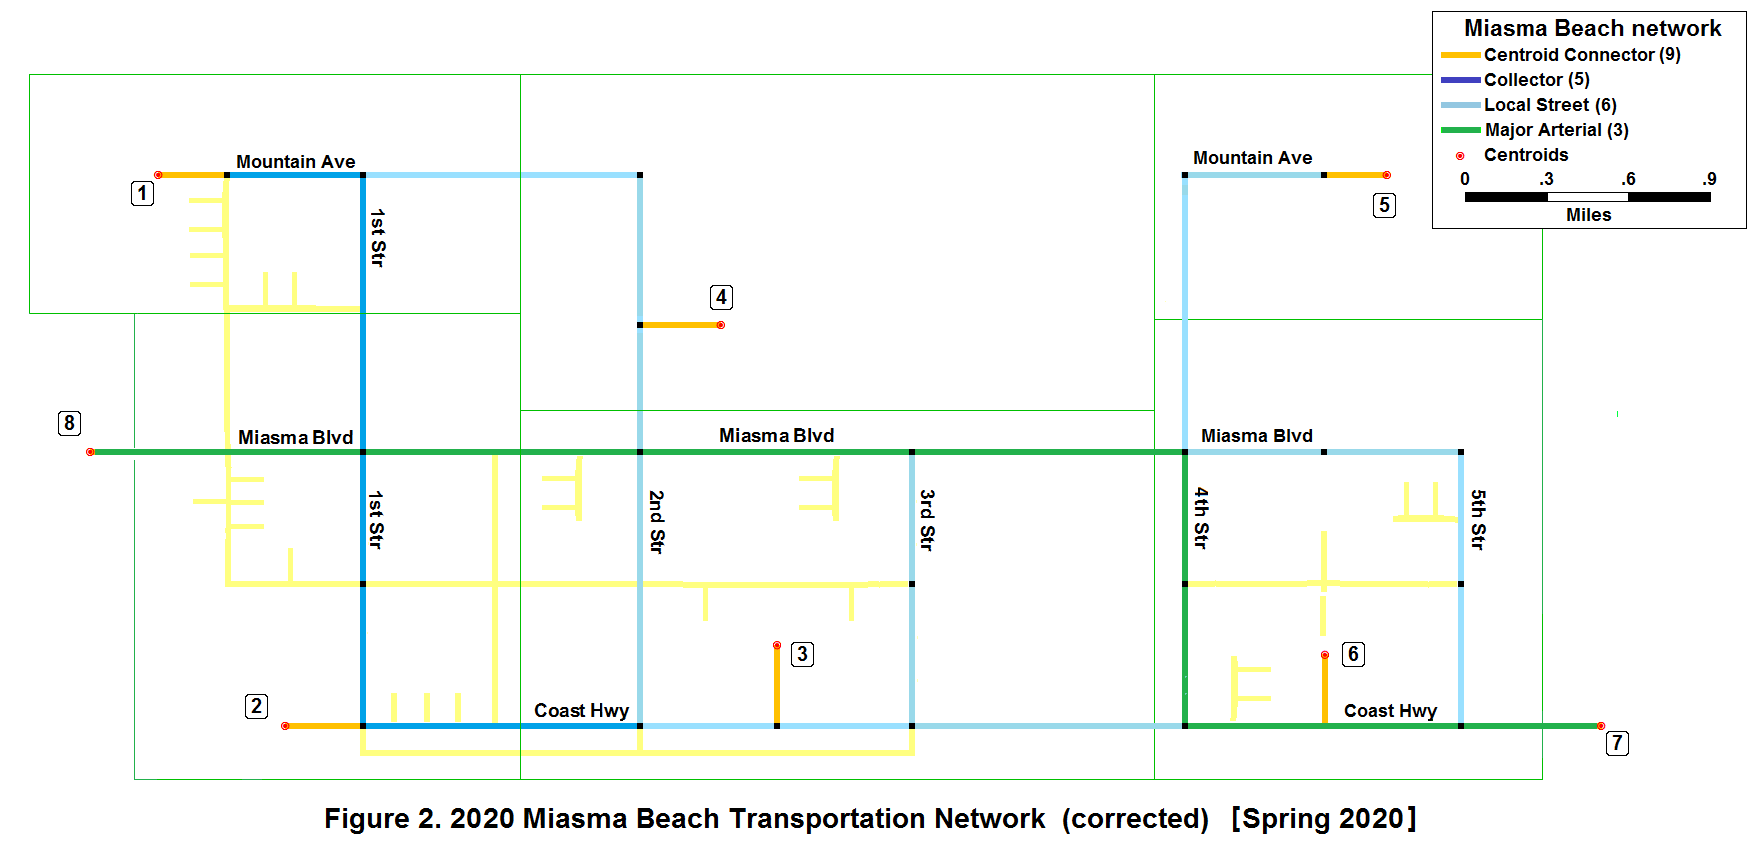
Depicted below is the corrected 2020 Miasma Beach network. Using the network map and the information in Task 1 Table 1, convert speeds and distances to travel times. Produce a network map depicting link distance, speed, and travel time annotated on each link. You may use TransCAD to complete the calculations and produce the final labeled network, but you must do this work for your individual network.
Problem 2. Performance Analysis (20 points)
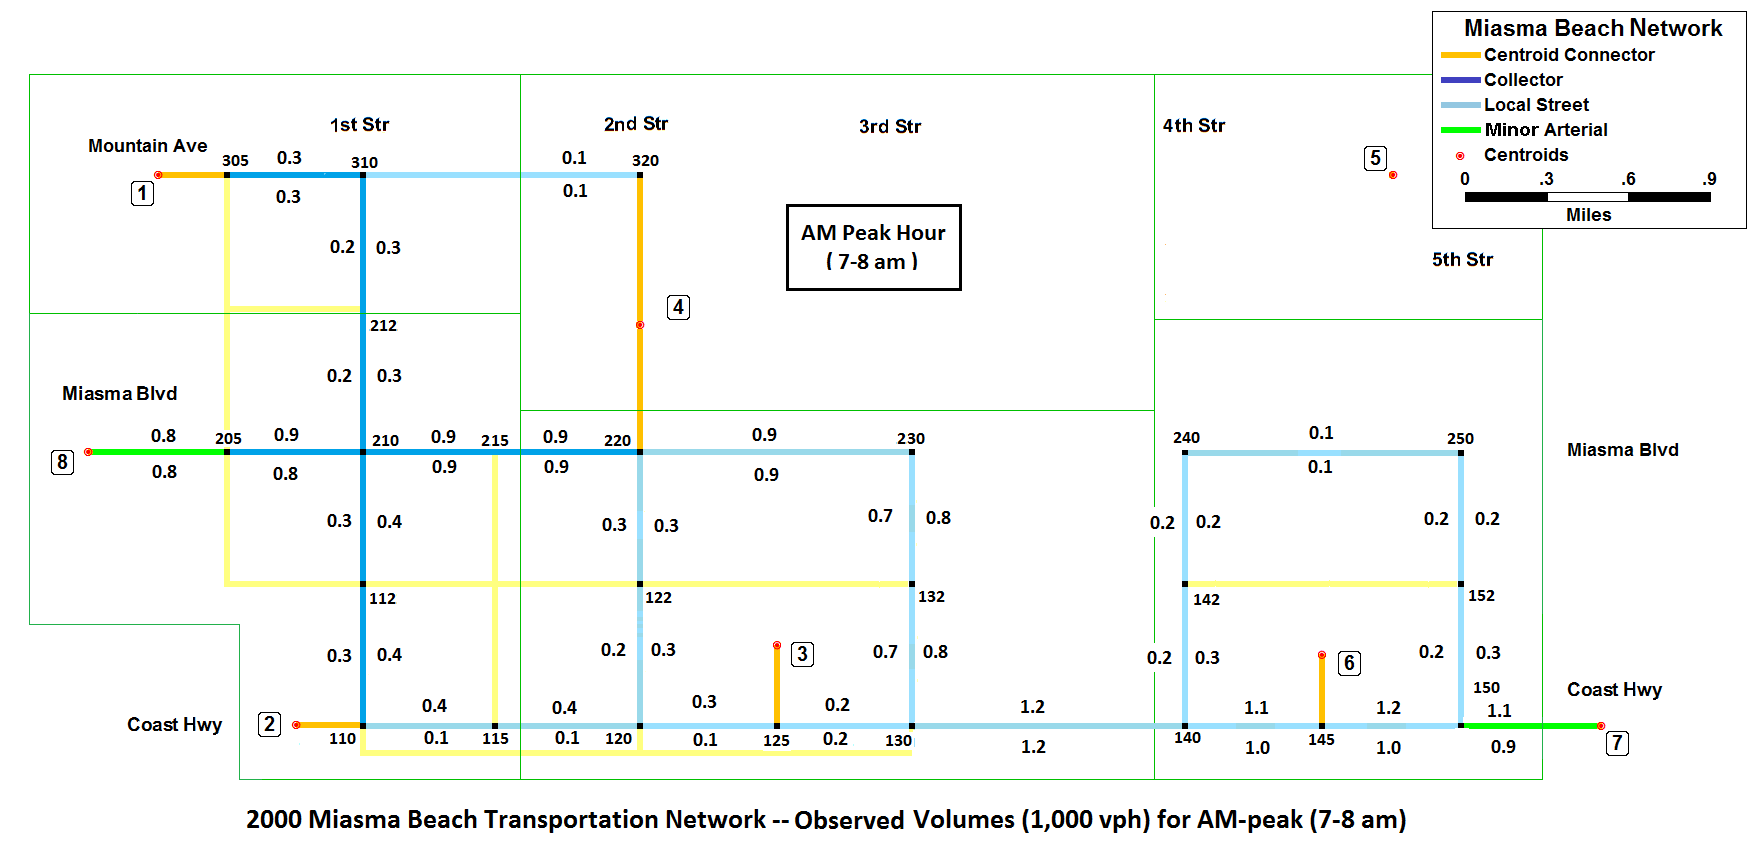
Depicted below is the 2000 Miasma Beach transportation network with observed 2000 traffic volumes (kvph by direction) for the AM peak hour (7-8 AM). Calculate performance characteristics for each link (VMT, VHT, speed) and summarize results by link facility type as well as by network-wide totals for VMT, VHT, and average speed. Use the BPR link performance function to estimate link travel times based on observed volumes (use default values for α and β): [ t = t0(1+α(vol/cap)β) ]. Use the tabular format provided ( xls ). Do not include centroid connectors.
Computation of Level-of-Service (LOS) can be complex and varies by facility type. Typically, freeway sections utilize link traffic density while arterials utilize link average speed and average time spent following. To simplify analysis, use the density-based assessment for all link types.
      Table 3.12 Density Ranges for Freeway LOS
     -------------------------------------------
       Level of Service      Density Range
            (A-F)            (veh/mi/lane)
     -------------------------------------------
              A                  0 - 11
              B               > 11 - 18
              C               > 18 - 26
              D               > 26 - 35
              E               > 35 - 45
              F               > 45
     -------------------------------------------
Describe any 2000 network problems. Consider LOS and observed volume/capacity ratios as a possible congestion measure. Summarize 2000 observed VMT, VHT, and average speed (total and by facility type).
Problem 3. Minimum Paths (20 points)
Apply Dijkstra's Algorithm by hand, as illustrated in class, for either part 3A or 3B:
- Find two minimum path trees for a single centroid (1-6) from the Miasma Beach network, using travel times from Problem 1 for one skim tree and distance for the second. Compare the two skim trees (since link speeds vary, so may the resulting skims). Show all work. You should verify your results with TransCAD.
- Find two minimum path time trees for centroids 2, 3, or 4 from
the in-class network.
Include tables and plots that should approximate presentation standards. Use either the table format or the graph format (see skim tree notes). Plot the minimum path tree for each case. Construct the interzonal travel time matrix (tij) corresponding to the Miasma or class networks, including computed O-D travel times (or distances), including those from class.
Problem 4. Cost of Network Improvements (10 points)
Based on the 2000 Transportation Study, the City of Miasma Beach expanded the transportation network. Using the cost estimates provided, compute the cost of the network improvements between 2000 (the network in Problem 2) and 2020 (the network in Problem 1). Use the same spreadsheet as in Problem 2.
Please note that all costs are per lane-mile and that all links improvements and additions must include link costs and the associated intersection costs, plus any development penalties.
Review Topics: Network Supply/Performance
- Network Characteristics: link and node types, link and node attributes
- Minimum Path Algorithms: Dijkstra (Label-setting) to find path sequence and path length
- Link Performance Functions: BPR & other empirical functions, Fundamental Diagram, Queueing
Review Questions: (for review only: do not submit with HW#3)
- What is a skim tree?
- How does label-setting differ from label-correcting in Minimum Path Algorithms?
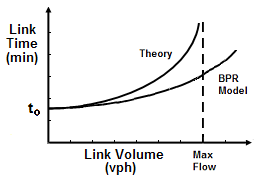
- The diagram below depicts the BPR link performance function and the theoretical
relationship that would be expected based on queueing theory or the fundamental
diagram. Why are they different?
Last Updated: 5 April 2020